 CSAIS Community Typology Explorer
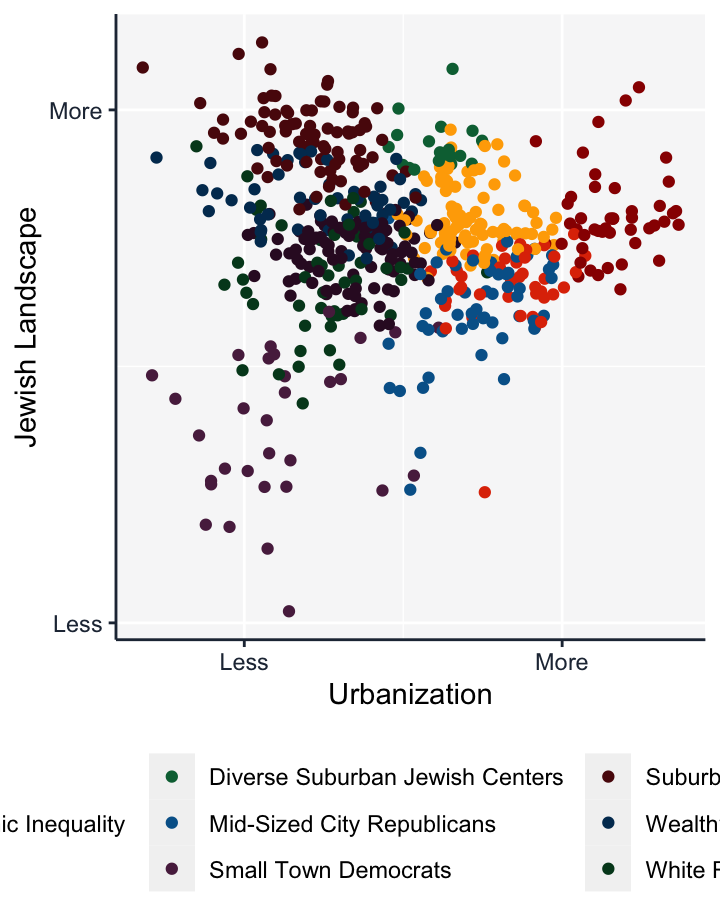
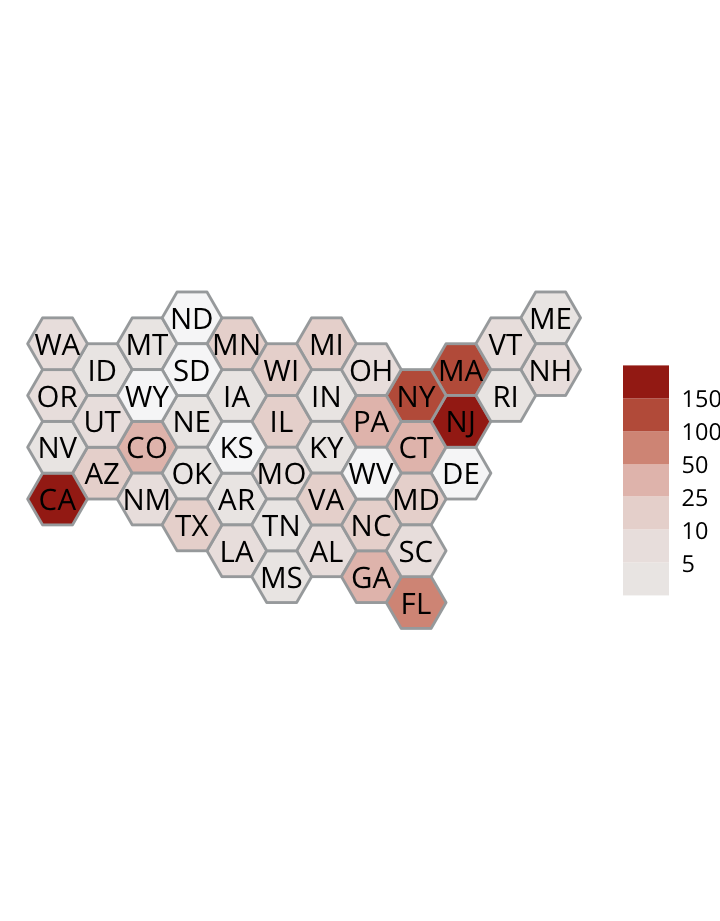
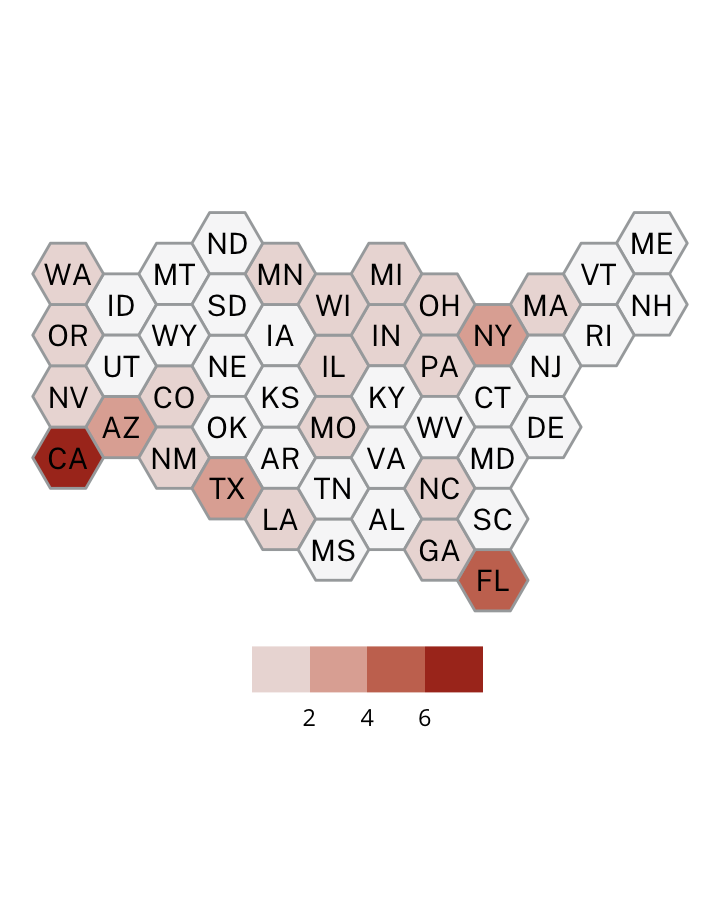
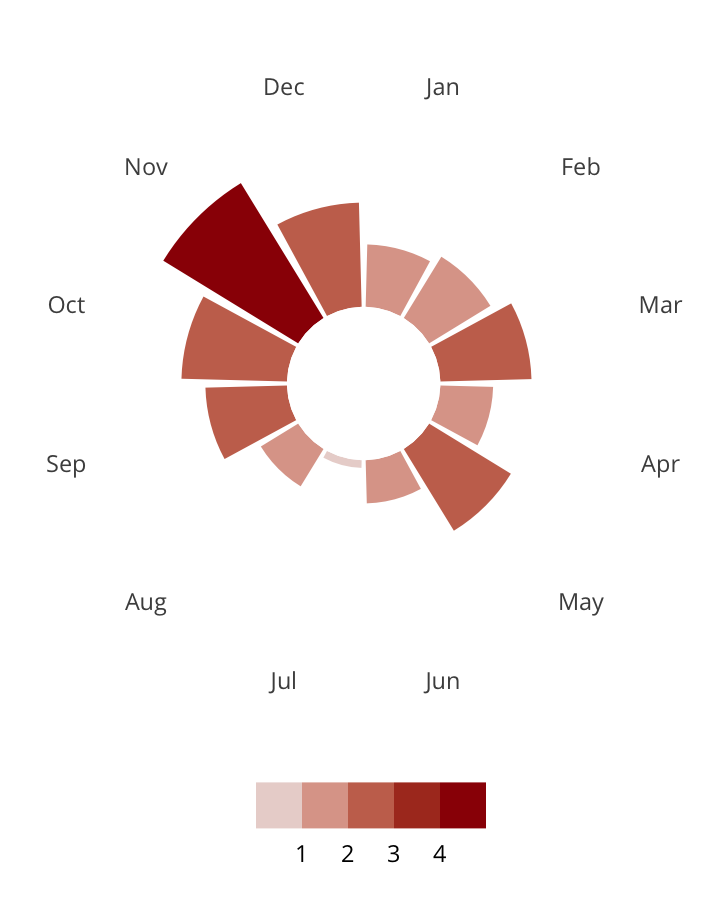
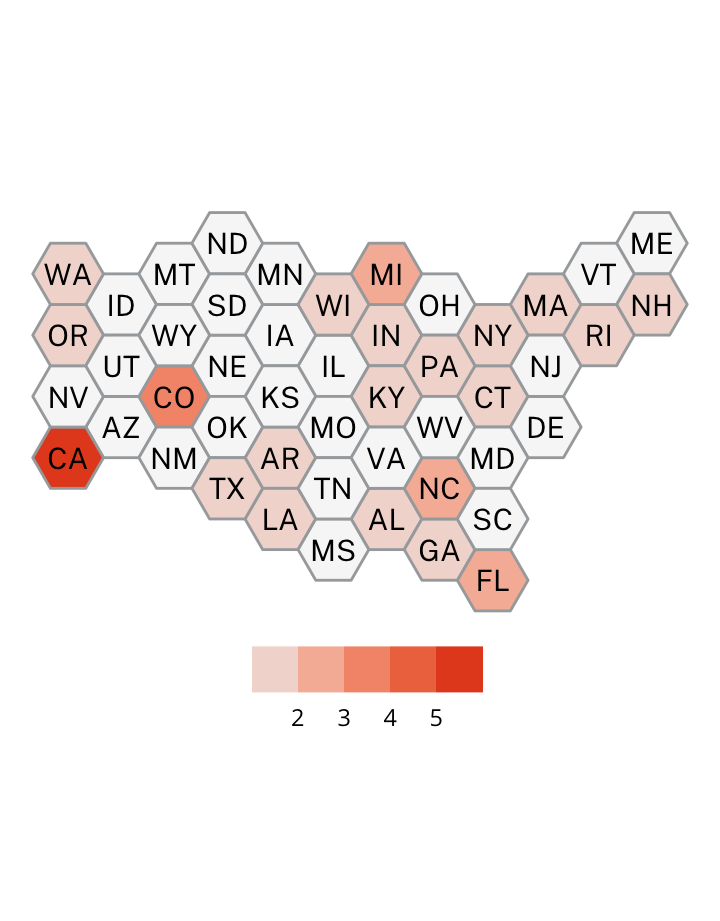
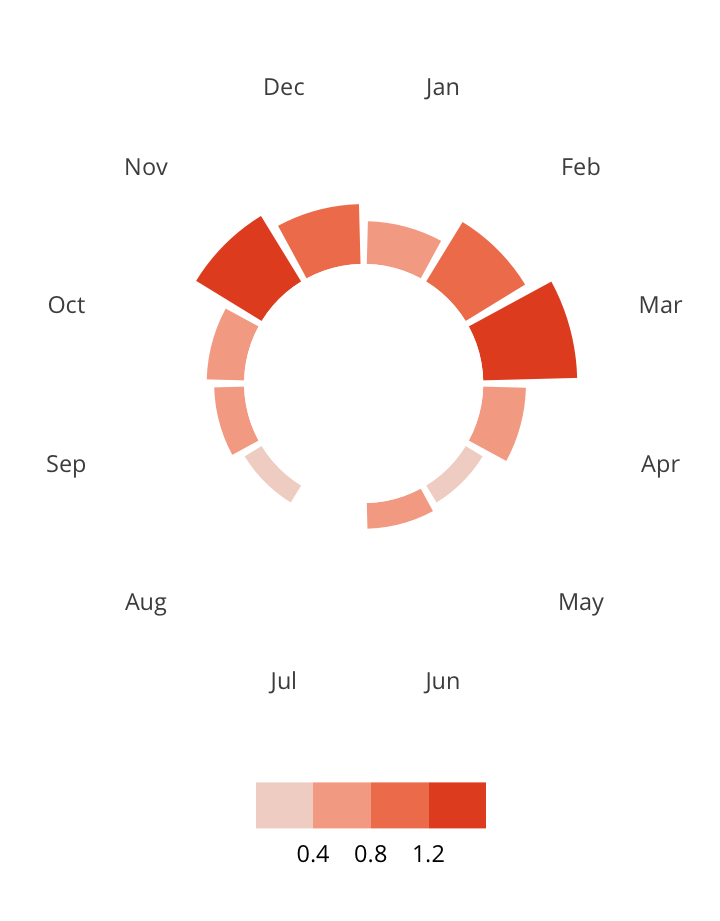
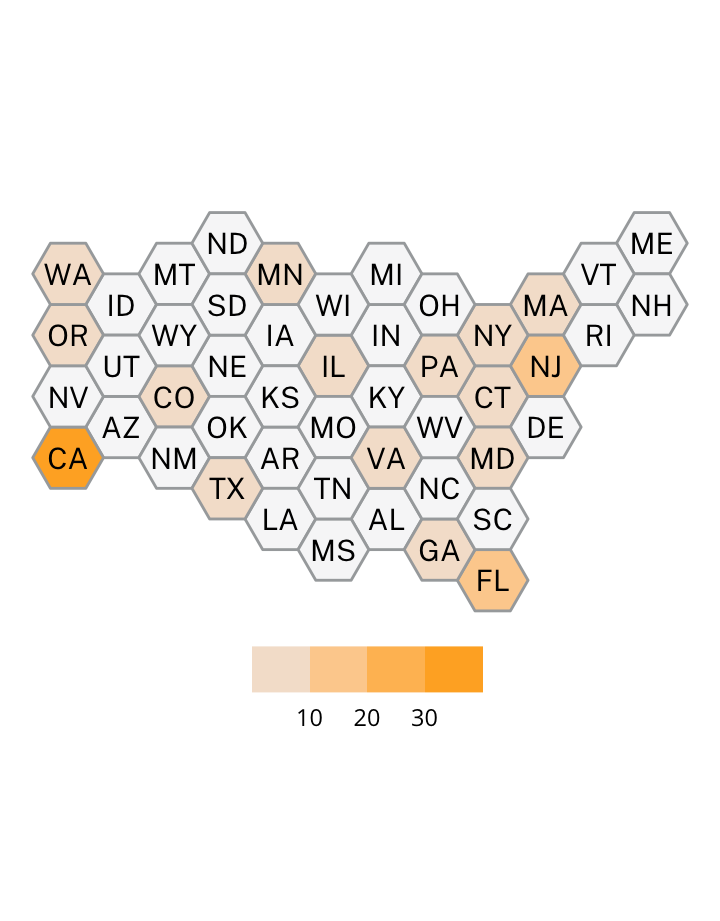
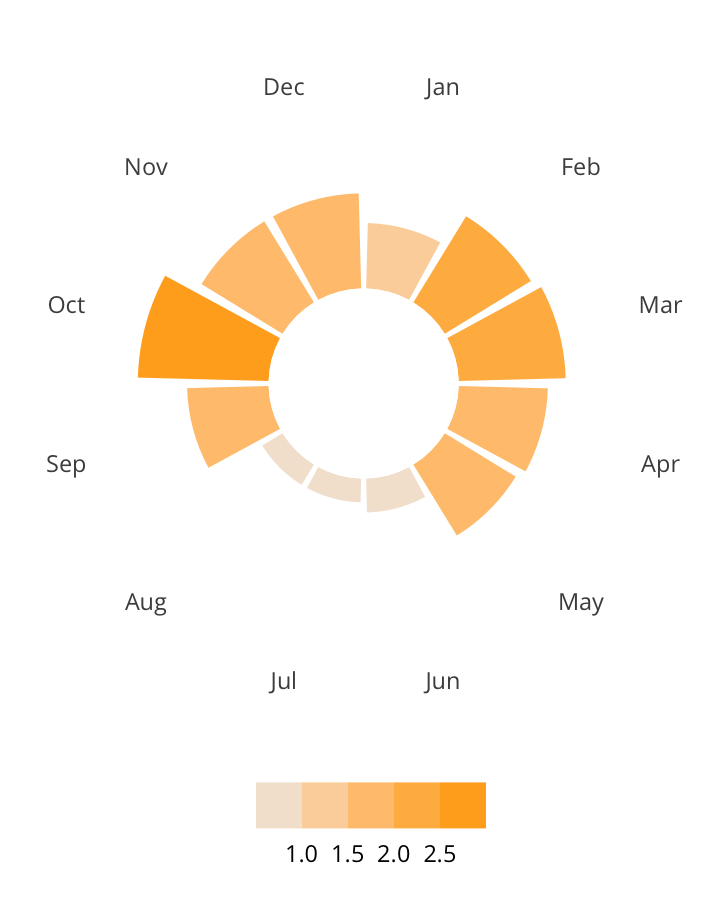
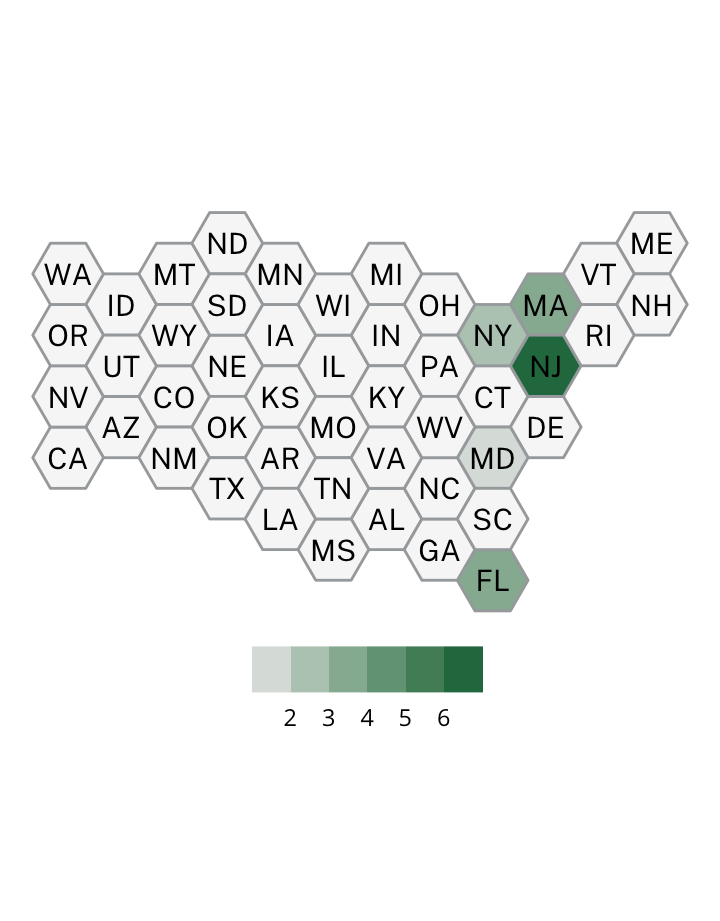
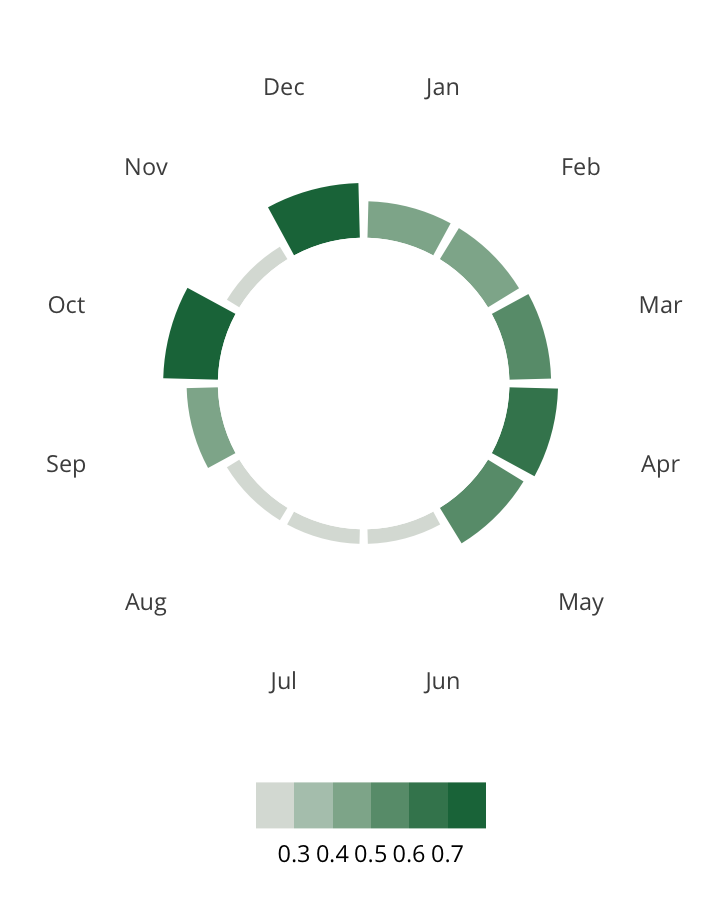
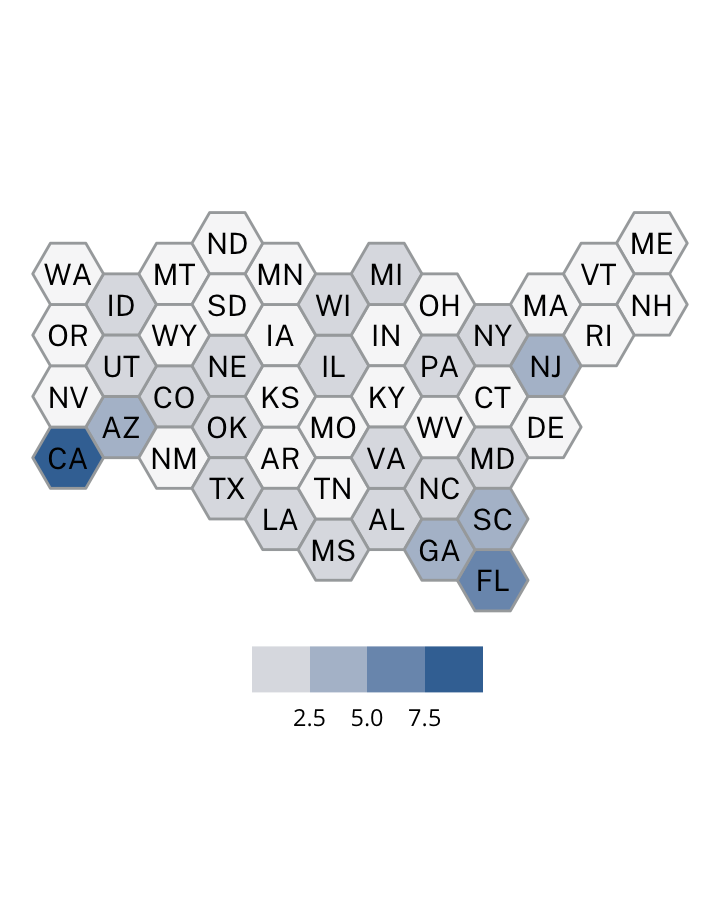
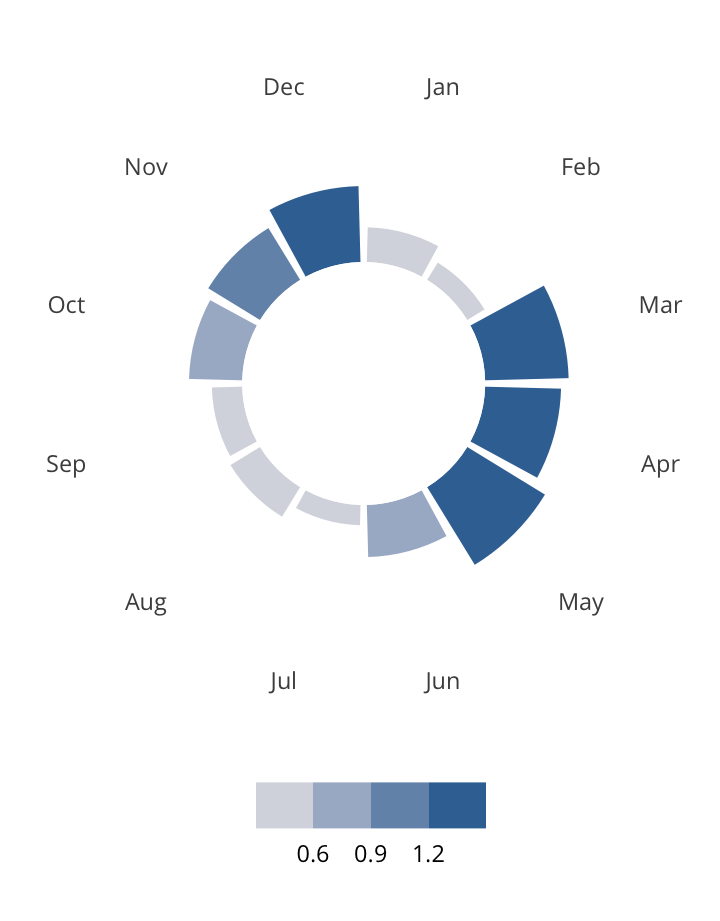
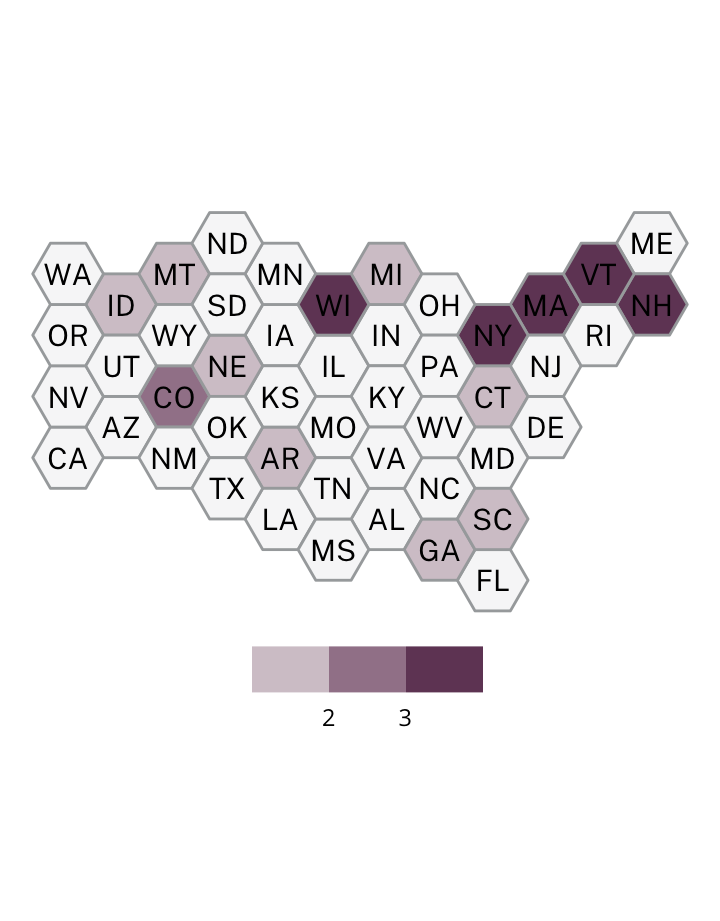
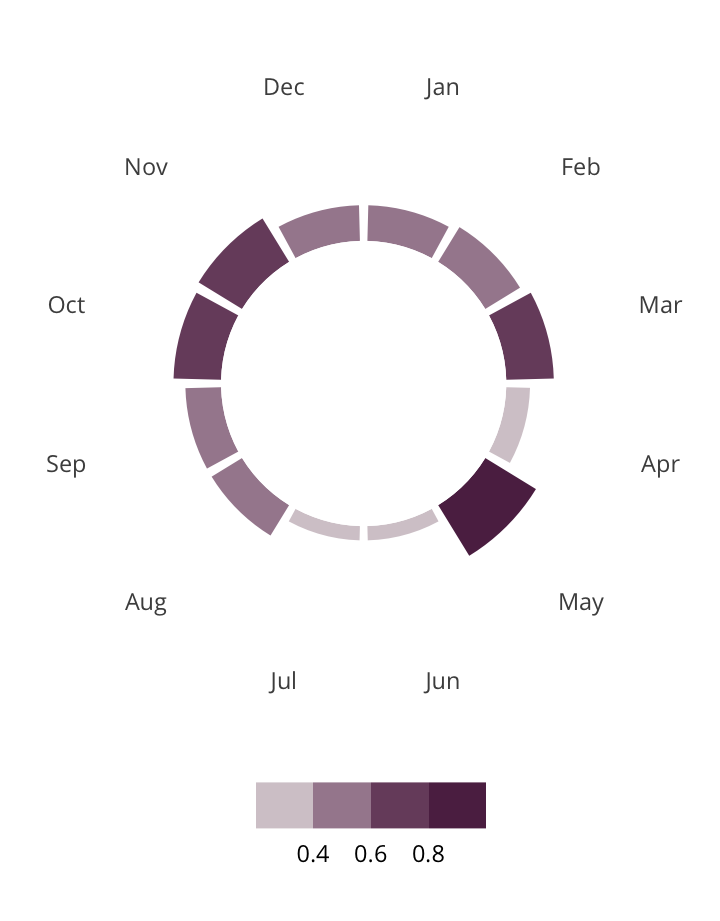
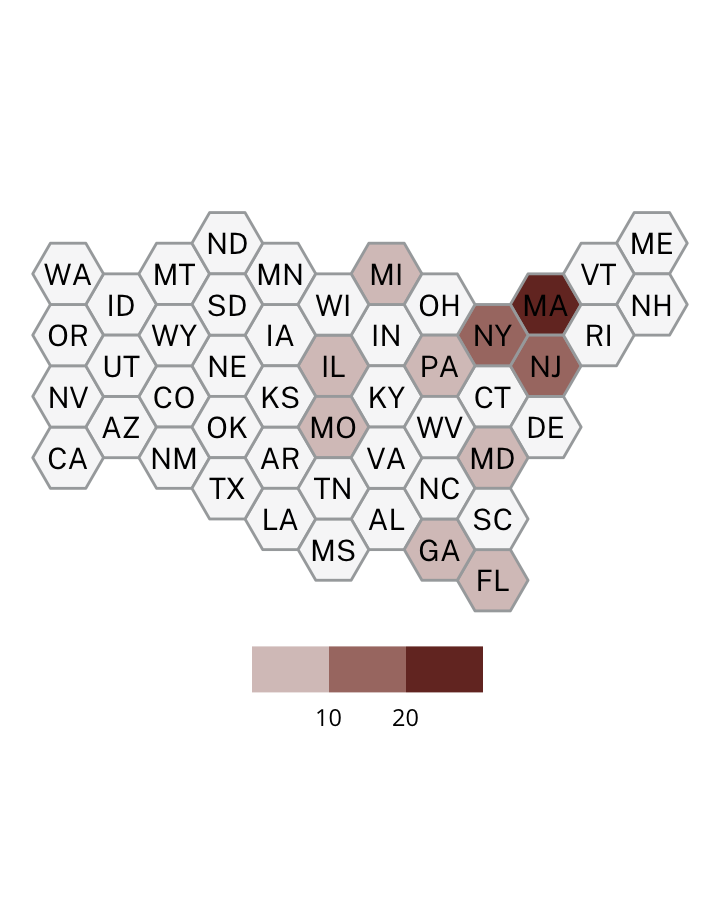
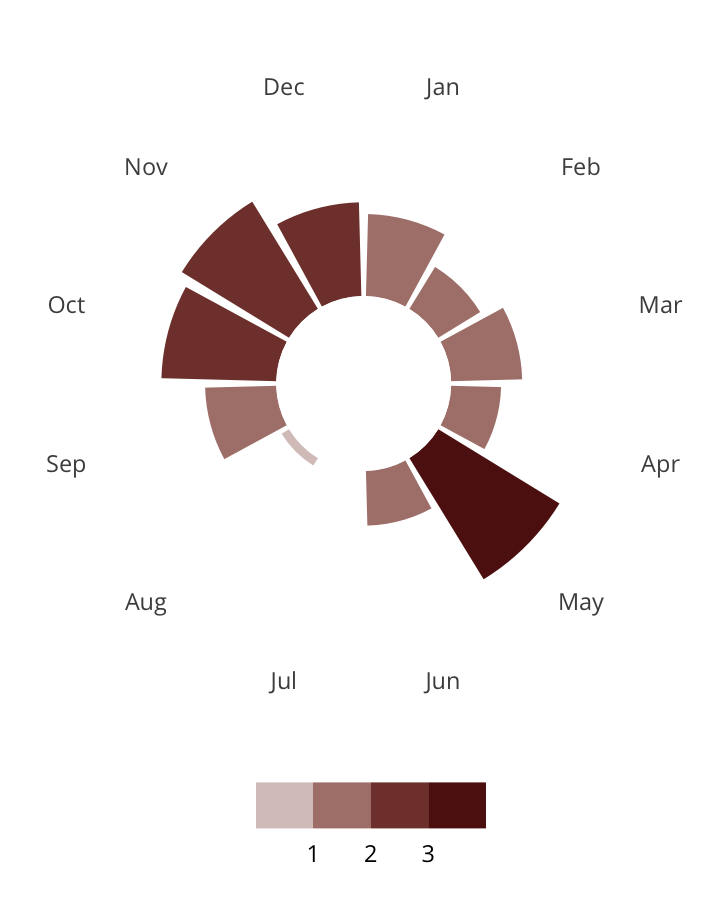
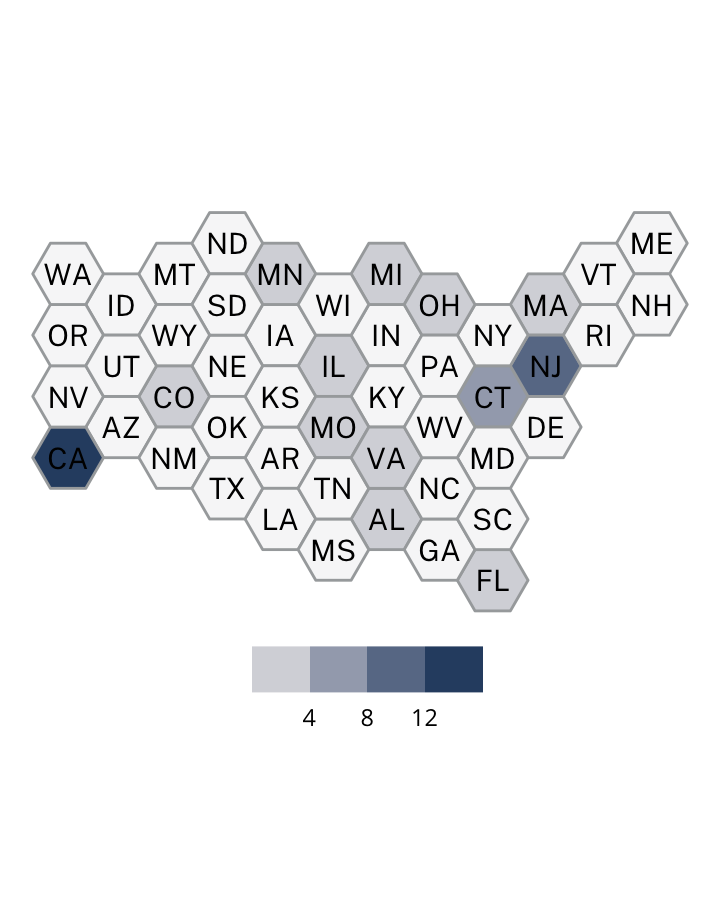
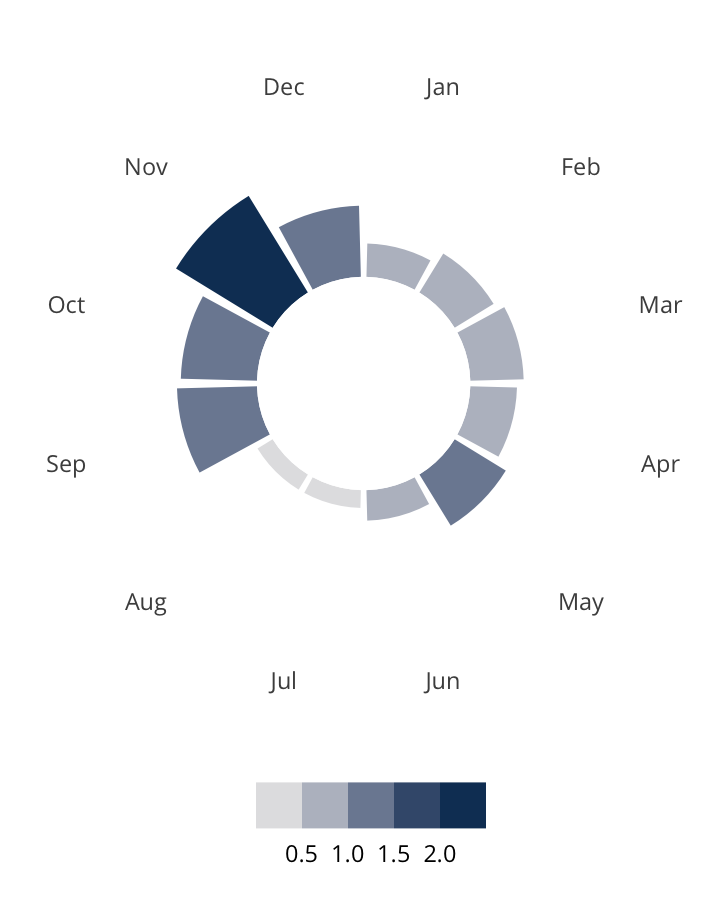
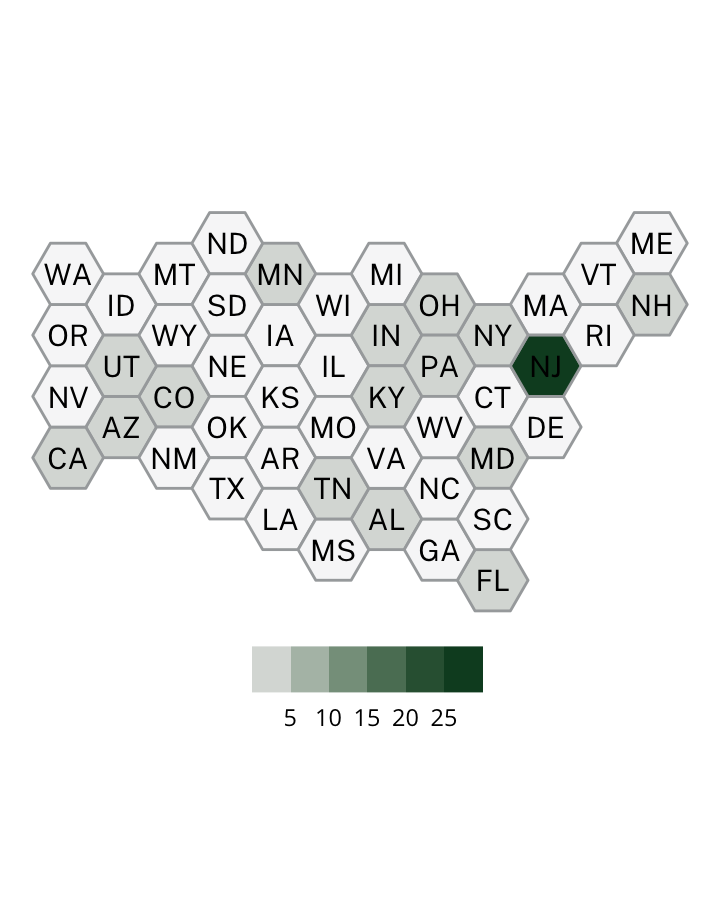
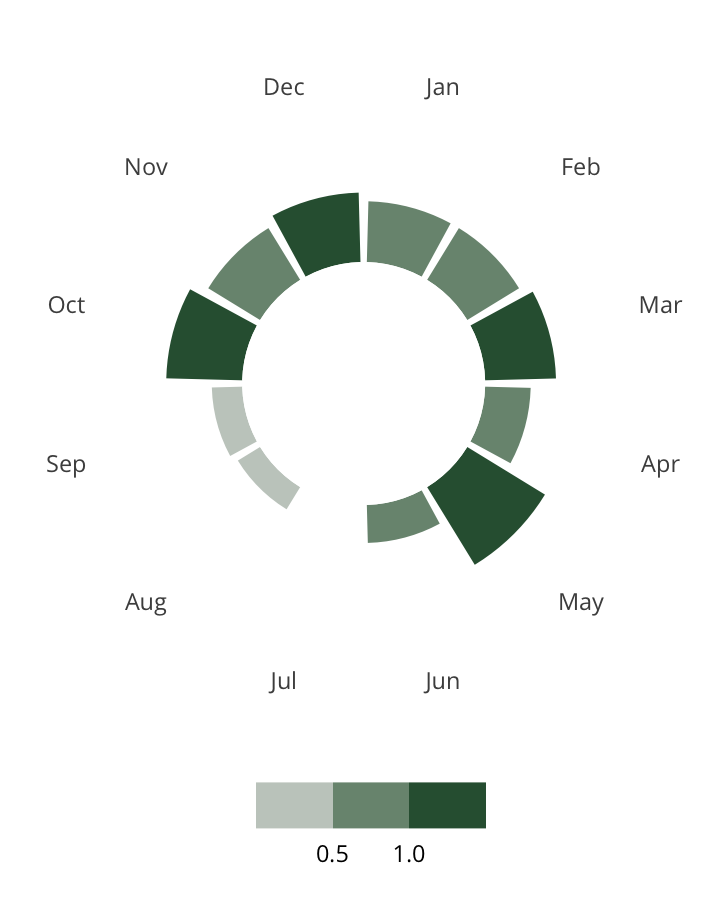
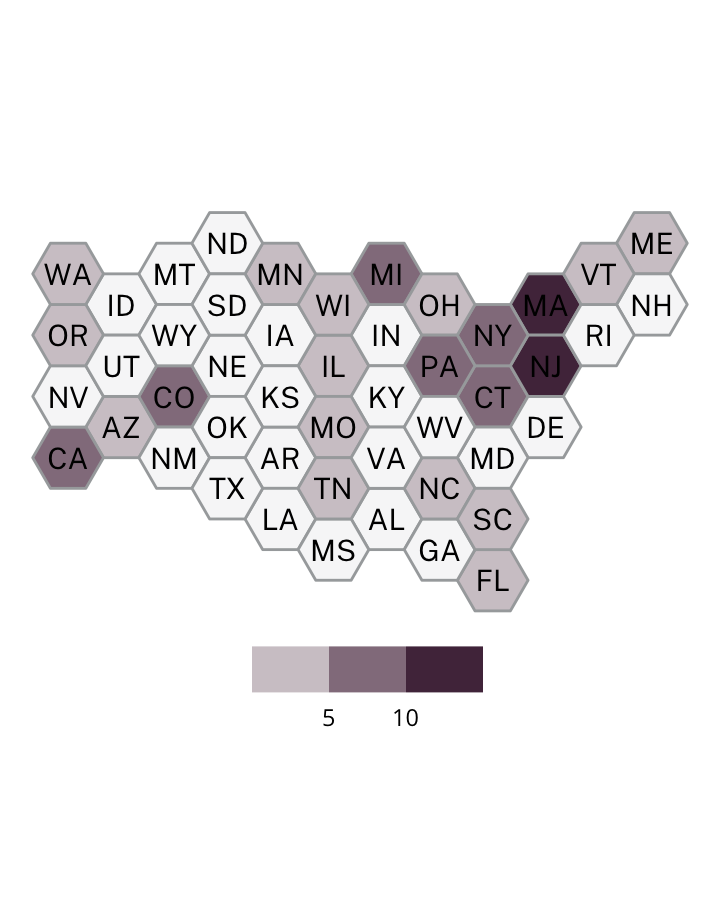
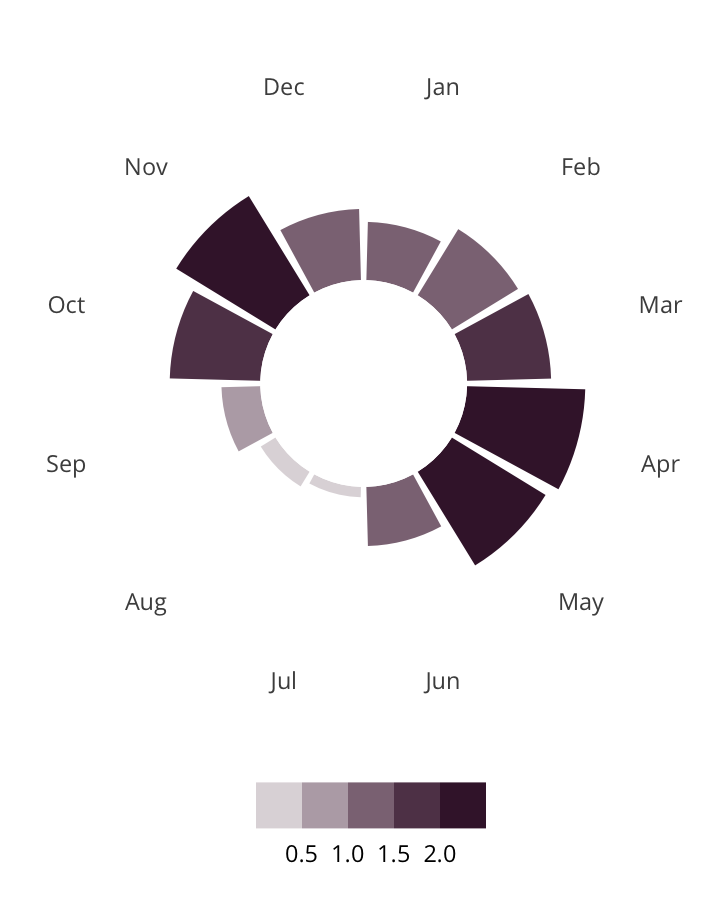
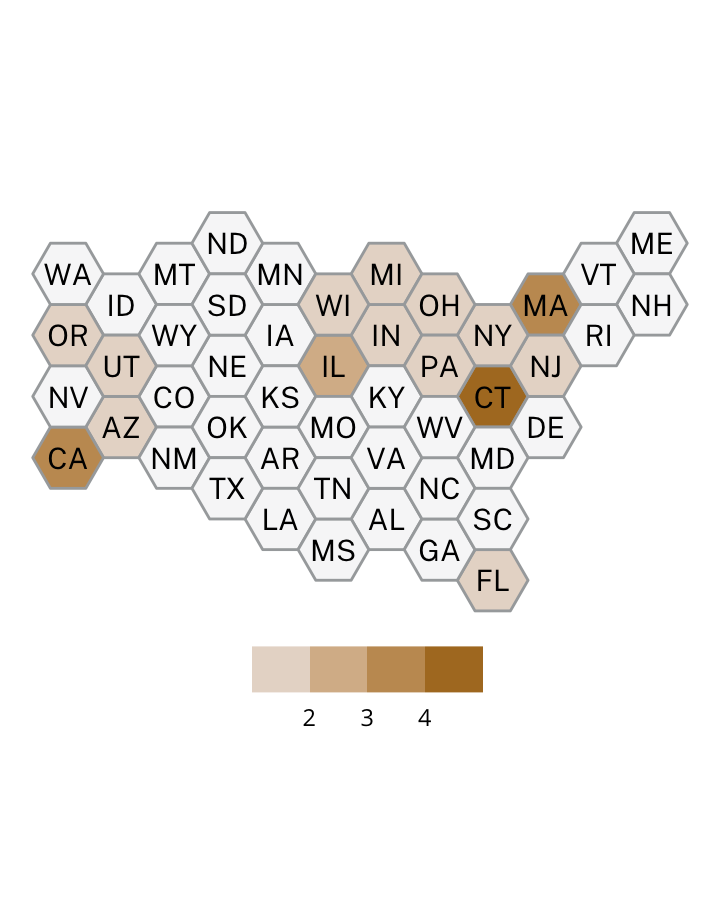
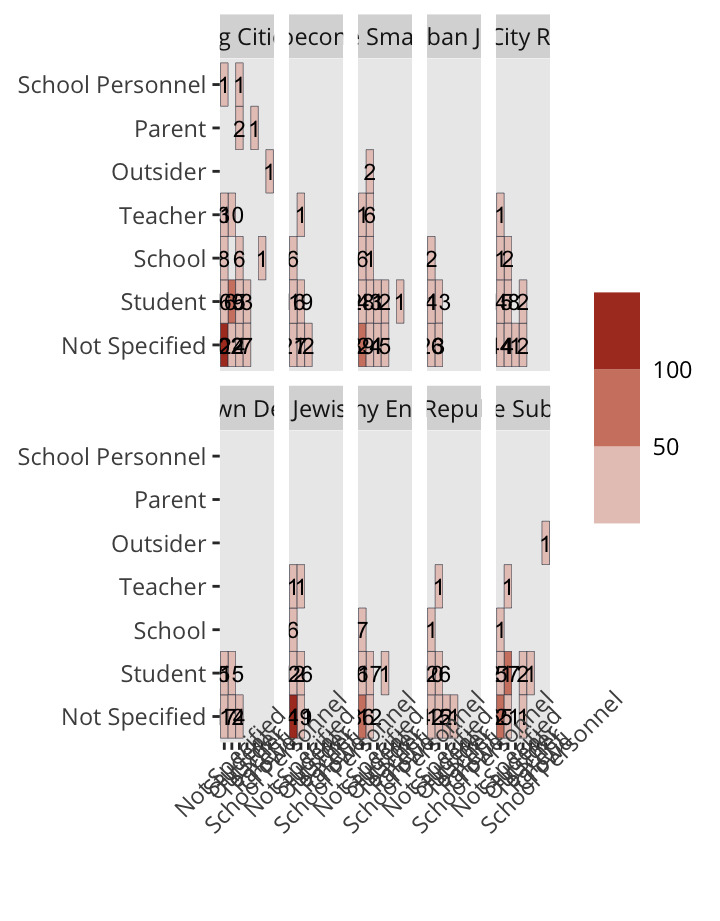
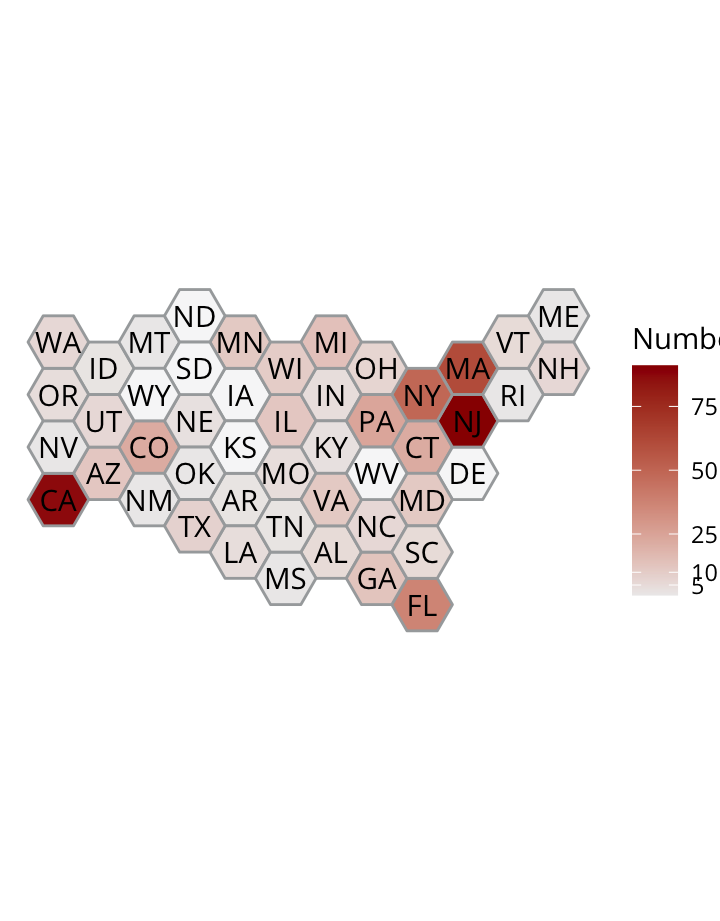
Antisemitic incidents in schools are a widespread and pervasive phenomenon. The Anti-Defamation League has reported a three-fold increase in school-based antisemitic incidences between 2015 and 2018, and a nearly two-fold increase in violent and non-violent incidences of antisemitism in general nationwide.
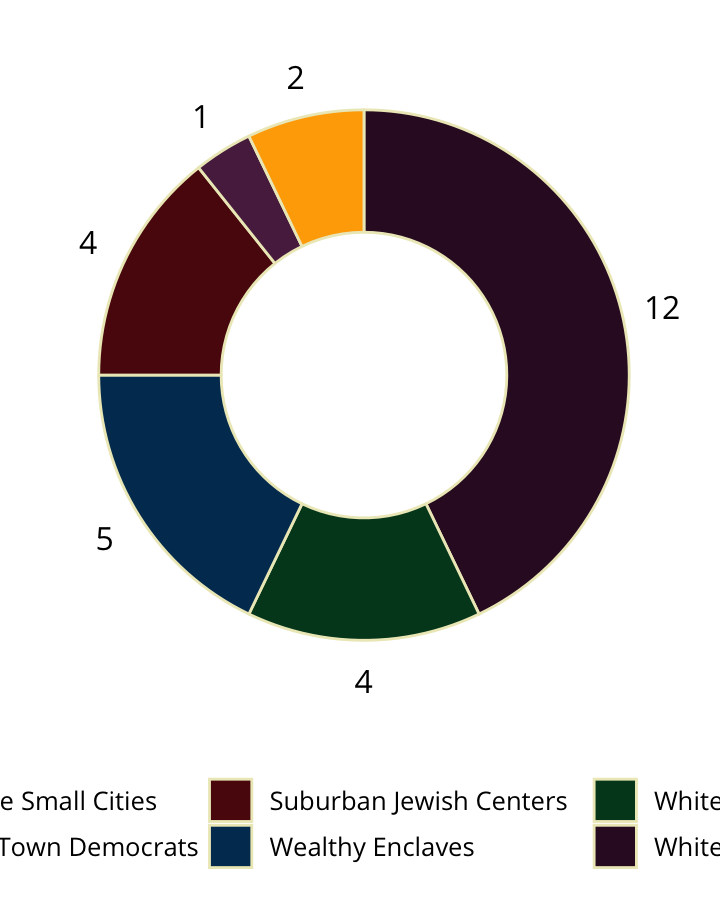
This project utilizes data from the ADL H.E.A.T. Map between 2016 and 2019 to identify incidents of antisemitism that specifically took place in schools. These incidents in schools are influenced by demographic, historical, social, and political factors. This project brings this data together to construct a community typology at the national level. This typology will provide insight into the ways that school-based incidents of hate are enacted and reported in context.
Developing a community typology will allow providers to better target specific demographic, historical, and political attributes of the communities in which these incidents occur through curriculum and learning experiences.
1369
January 1, 2016 - December 31, 2019
577
10


Please cite this work with the following:
Price, J. F., Snorten, C., Wilson, J., Schall, C., Hasan, M. A., Luo, X., Jahin, S. M. A. (2021). “Community Studies of Antisemitism In Schools (CSAIS) Community Typology Explorer.” https://jeremyfprice.github.io/csais-dashboard.
This work is supported by a Research Start-Up Funds Grant (RSFG) from the IUPUI Office of the Vice Chancellor for Research, a Block Grant from the IU School of Education-Indianapolis at IUPUI, and an IUPUI Institute for Integrative AI Collaborative Seed Fund Grant.
Big Cities
Big Cities are characterized primarily by high populations, high diversity levels, and relatively low median income. Big Cities are frequently the core communities for large metropolitan areas.
Some examples of Big Cities include Dallas, TX, Denver, CO, Orlando, FL, and Charlotte, NC.
Minneapolis, MN CC BY-SA 4.0
| Measure | Median Score | Adjusted Score | Description |
|---|---|---|---|
| Community Interaction | 0.000 | -0.012 | N/A |
| Diversity Level | 0.827 | 0.269 | High Diversity |
| Median Income | 0.154 | -0.132 | Low Median Income |
| Jewish Infrastructure | -0.879 | 0.052 | N/A |
| Politics | 0.285 | -0.011 | N/A |
| Population | 0.857 | 0.571 | High Population |


Centers of Socioeconomic Inequality
Centers of Socioeconomic Inequality are characterized by a rural character with a higher than average population and level of diversity along with a low median income. Centers of Socioeconomic Inequality are typically college towns, state capitals, and one-industry communities.
Some examples of Centers of Socioeconomic Inequality include Durham, NC, Daytona Beach, FL, Fort Collins, CO, and Boulder, CO.
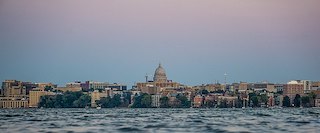
Madison, WI CC BY-SA 4.0
| Measure | Median Score | Adjusted Score | Description |
|---|---|---|---|
| Community Interaction | 0.134 | 0.122 | More Rural |
| Diversity Level | 0.674 | 0.116 | High Diversity |
| Jewish Infrastructure | -0.960 | -0.029 | N/A |
| Median Income | 0.123 | -0.163 | Low Median Income |
| Politics | 0.251 | -0.044 | N/A |
| Population | 0.571 | 0.286 | High Population |


Diverse Small Cities
Diverse Small Cities are characterized by relatively high populations and high diversity levels. Diverse Small Cities can be situated within a large metropolitan area or stand alone outside of larger metropolitan areas.
Some examples of Diverse Small Cities include Thornton, CO, Highland Park, NJ, North Bergen, NJ, and South Pasadena, CA.
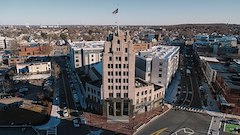
Quincy, MA CC BY-SA 4.0
| Measure | Median Score | Adjusted Score | Description |
|---|---|---|---|
| Community Interaction | 0.012 | 0.000 | N/A |
| Diversity Level | 0.780 | 0.222 | High Diversity |
| Jewish Infrastructure | -0.957 | -0.025 | N/A |
| Median Income | 0.248 | -0.038 | N/A |
| Politics | 0.258 | -0.037 | N/A |
| Population | 0.429 | 0.143 | High Population |


Diverse Suburban Jewish Centers
Diverse Suburban Jewish Centers are characterized by high levels of Jewish Infrastructure and high diversity levels. These centers are typically inner-suburbs, and are found entirely on the east coast.
Some examples of Diverse Suburban Jewish Centers include Hackensack, NJ, Englewood, NJ, Boca Raton, FL, and Spring Valley, NY.
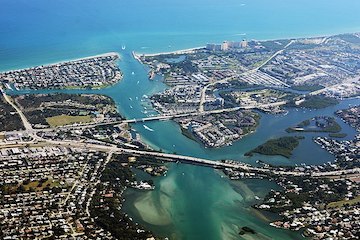
Jupiter, FL CC BY-SA 4.0
| Measure | Median Score | Adjusted Score | Description |
|---|---|---|---|
| Community Interaction | 0.012 | 0.000 | N/A |
| Diversity Level | 0.789 | 0.231 | High Diversity |
| Jewish Infrastructure | -0.130 | 0.802 | High Jewish Infrastructure |
| Median Income | 0.276 | -0.010 | N/A |
| Politics | 0.315 | 0.020 | N/A |
| Population | 0.286 | 0.000 | N/A |


Mid-Sized City Republicans
Mid-Sized City Republicans are similar to the more populous Big Cities in that they are characterized primarily by high populations and relatively low median income, but politically they lean Republican. Mid-Sized City Republicans can be situated within a larger metropolitan area or stand alone outside of larger metropolitan areas.
Some examples of Mid-Sized City Republicans include Charleston, SC, Altamonte Springs, FL, Reading, PA, and Virginia Beach, VA.
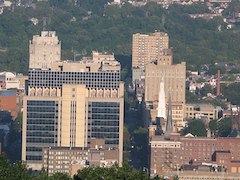
Reading, PA CC BY-SA 2.0
| Measure | Median Score | Adjusted Score | Description |
|---|---|---|---|
| Community Interaction | 0.012 | 0.000 | N/A |
| Diversity Level | 0.645 | 0.087 | N/A |
| Jewish Infrastructure | -0.979 | -0.048 | N/A |
| Median Income | 0.162 | -0.123 | Low Median Income |
| Politics | 0.709 | 0.414 | Republican |
| Population | 0.429 | 0.143 | High Population |


Small Town Democrats
Small Town Democrats are characterized primarily by a rural setting, low populations, low diversity levels, a relatively low median income, and politically Democratic. Many Small Town Democrats are resort towns. Most Small Town Democrats can be found in New England and the Upper Midwest.
Some examples of Small Town Democrats include Danville, AR, Morristown, VT, Cairo, GA, and Milton, WI.
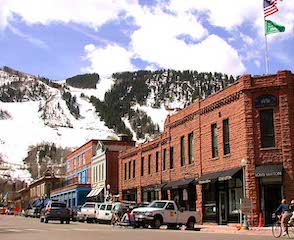
Aspen, CO CC BY-SA 4.0
| Measure | Median Score | Adjusted Score | Description |
|---|---|---|---|
| Community Interaction | 0.512 | 0.500 | More Rural |
| Diversity Level | 0.177 | -0.381 | Low Diversity |
| Jewish Infrastructure | -0.991 | -0.059 | N/A |
| Median Income | 0.149 | -0.137 | Low Median Income |
| Politics | 0.158 | -0.138 | Democratic |
| Population | 0.143 | -0.143 | Low Population |


Suburban Jewish Centers
Suburban Jewish Centers are characterized primarily by very high Jewish infrastructure levels, high income levels, and relatively low levels of diversity. Suburban Jewish Centers are on the East Coast and Midwest as part of larger metropolitan areas.
Some examples of Suburban Jewish Centers include Lexington, MA, Oakland, NJ, Emerson, NJ, and Sudbury, MA.
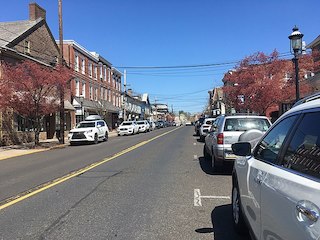
Newtown, PA CC BY-SA 4.0
| Measure | Median Score | Adjusted Score | Description |
|---|---|---|---|
| Community Interaction | 0.012 | 0.000 | N/A |
| Diversity Level | 0.455 | -0.103 | Low Diversity |
| Jewish Infrastructure | -0.130 | 0.802 | High Jewish Infrastructure |
| Median Income | 0.470 | 0.185 | High Median Income |
| Politics | 0.302 | 0.007 | N/A |
| Population | 0.286 | 0.000 | N/A |


Wealthy Enclaves
Wealthy Enclaves are identified entirely by high median incomes. Wealthy Enclaves are scattered across the US as suburbs, exurbs, and more rural towns.
Some examples of Wealthy Enclaves include Montclair, NJ, Calabasas, CA, Burlingame, CA, and New Albany, OH.
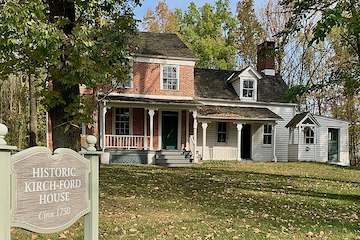
Warren Township, NJ CC BY-SA 4.0
| Measure | Median Score | Adjusted Score | Description |
|---|---|---|---|
| Community Interaction | 0.012 | 0.000 | N/A |
| Diversity Level | 0.525 | -0.034 | N/A |
| Jewish Infrastructure | -0.958 | -0.026 | N/A |
| Median Income | 0.597 | 0.311 | High Median Income |
| Politics | 0.258 | -0.037 | N/A |
| Population | 0.286 | 0.000 | N/A |


White Republicans
White Republicans are characterized primarily by low diversity levels and high levels of Republican affiliation. White Republicans are scattered across the US as cities, suburbs, exurbs, and more rural towns.
Some examples of White Republicans include Mount Washington, KY, Loch Arbour Village, NJ, Hanover, NJ, and Stanhope, NJ.
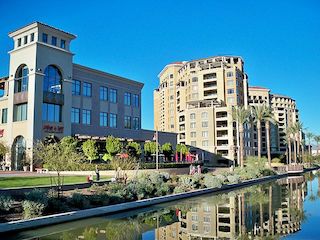
Scottsdale, AZ CC BY-SA 3.0
| Measure | Median Score | Adjusted Score | Description |
|---|---|---|---|
| Community Interaction | 0.012 | 0.000 | N/A |
| Diversity Level | 0.337 | -0.221 | Low Diversity |
| Jewish Infrastructure | -0.966 | -0.034 | N/A |
| Median Income | 0.374 | 0.088 | N/A |
| Politics | 0.639 | 0.343 | Republican |
| Population | 0.286 | 0.000 | N/A |


White Suburbs
White Suburbs are characterized by low diversity levels and are predominantly white. White Suburbs are scattered across the US as small cities, suburbs, exurbs, and villages.
Some examples of White Suburbs include Buellton, CA, Germantown, TN, Lakewood, OH, and Newington, CT.
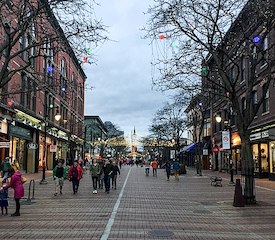
Burlington, VT CC BY-SA 4.0
| Measure | Median Score | Adjusted Score | Description |
|---|---|---|---|
| Community Interaction | 0.012 | 0.000 | N/A |
| Diversity Level | 0.349 | -0.210 | Low Diversity |
| Jewish Infrastructure | -0.932 | -0.001 | N/A |
| Median Income | 0.315 | 0.029 | N/A |
| Politics | 0.277 | -0.019 | N/A |
| Population | 0.286 | 0.000 | N/A |


Sundown Status


Incidents

Geography

Factors
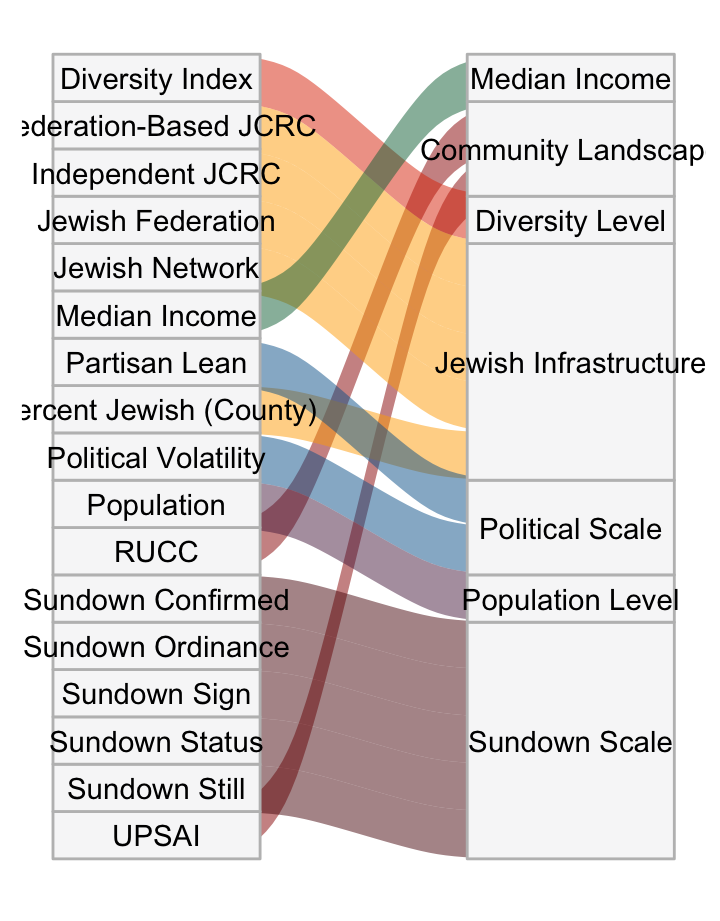
In identifying the ten community types, the following scales were used:
